Recommending a Data Warehouse
This webpage gives an overview of Gartner's 2019 'critical capabilities' analysis and showcases a webtool that provides personalized recommendations.
Dustin Lennon
July 2019
https://dlennon.org/archive/20190725_dwh
Abstract
Abstract
We introduce Gartner, Inc., as a leader in IT technology research and provide an overview of their May 2019 paper, “Critical Capabilities for Data Management Solutions for Analytics.” This paper describes several, potentialy desirable features of a data warehouse platform. We ingest user preferences for these features, combine them with scores published in the paper, and dynamically report a customized ranking of the relevant product offerings.
The Gartner Analyses
The Gartner Analyses
Gartner, Inc., an S&P 500 company, is a leading provider of information technology research targeted toward executive-level decision makers. Across various IT product categories, Gartner provides comparative reviews of companies providing relevant solutions. For example, ‘data management solutions for analytics’ and ‘analytics and business intelligence platforms’ are two of these product categories.
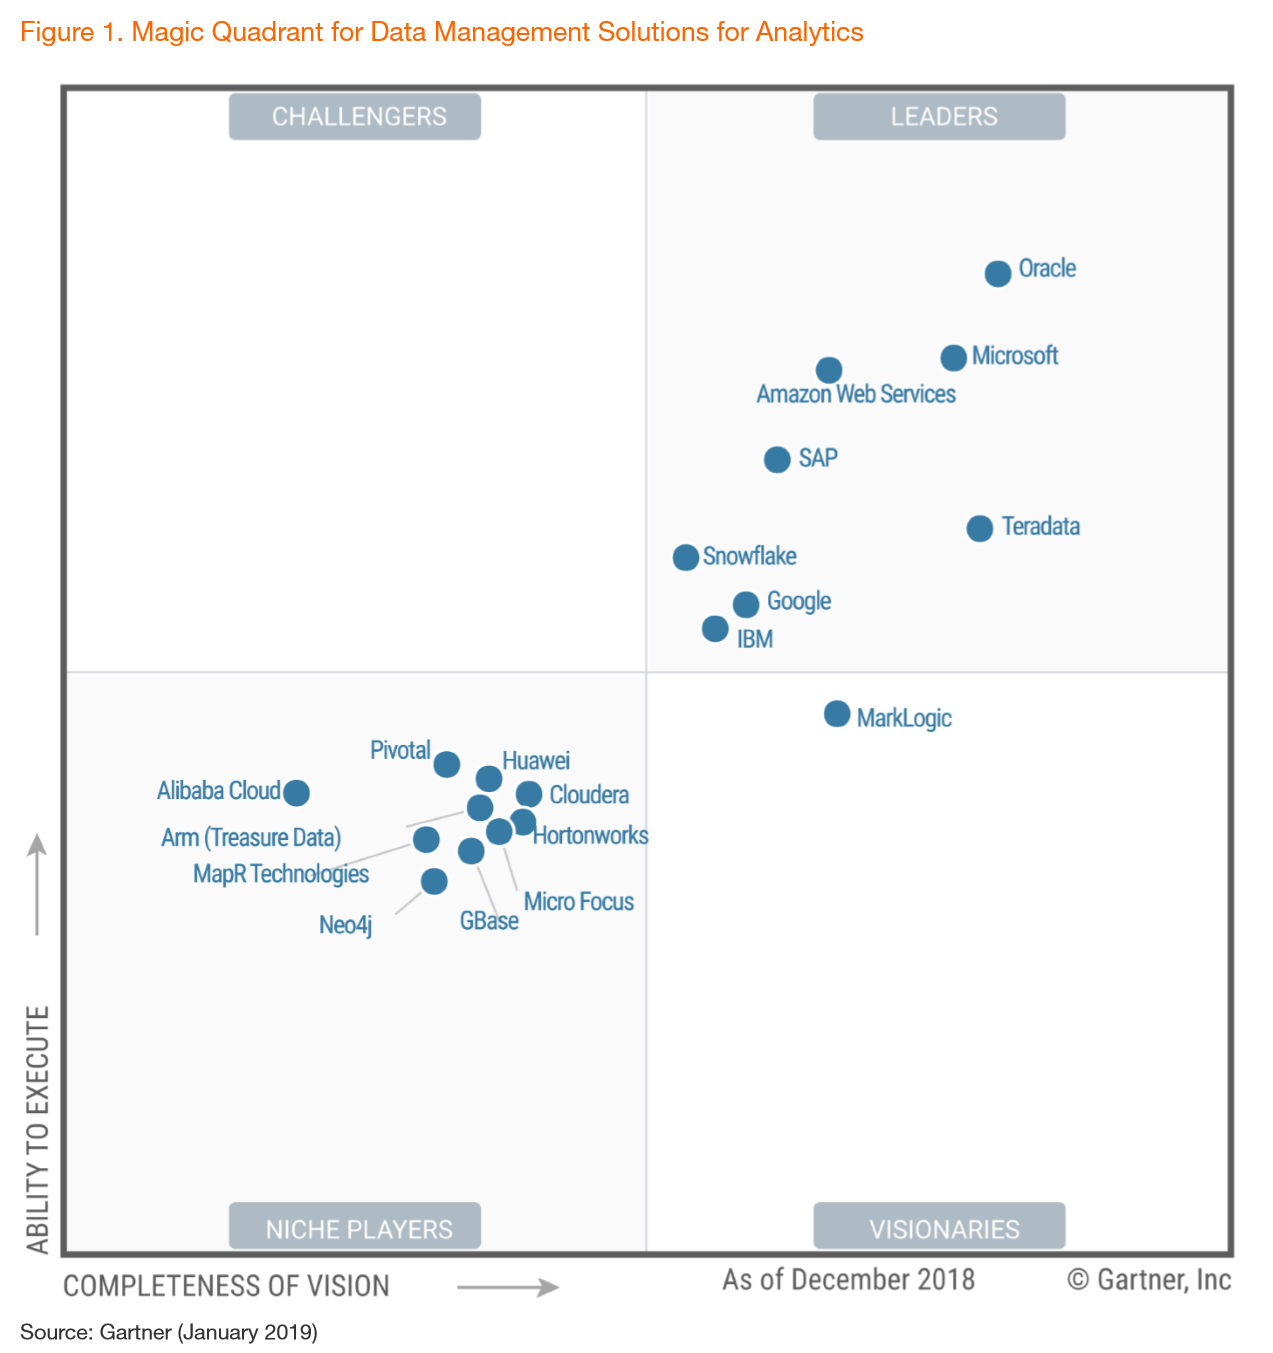
One of Gartner’s standard analyses is a ‘Magic Quadrant,’ a scatterplot of companies scored by ‘completeness of vision’ and ‘ability to execute.’ These metrics segment the companies into four classes identified by their location on the scatter plot as ‘leaders’, ‘challengers’, ‘niche players’, and ‘visionaries.’

Another Gartner product line is their ‘Critical Capabilities’ analyses. For a particular IT product category, Gartner provides a cross-comparision of features against companies offering products in the space. For the “Critical Capabilities for Data Management Solutions for Analytics” we discuss in this paper, there are twelve features and nineteen companies. Against a survey of active users, ones chosen by each company that meet some baseline criteria specified by Gartner, each feature-company pair is scored on a 1-5 scale. A three or higher is considered a passing score.
Critical Capabilities for Data Management Solutions for Analytics
Critical Capabilities for Data Management Solutions for Analytics
For the Data Management Solutions for Analytics product category, Gartner provides both fine- and coarse-scores of the product offerings. Here, the coarse scores correspond to broader use cases and are weighted aggregations of the finer scores; “Traditional Data Warehouse” and “Context-Independent Data Warehouse” are two examples of the four coarse metrics.
Correspondingly, the finer scores correspond to much more specific data warehouse features: “Workload Management” and “Flexible Scalability” exemplify this set of metrics. In what follows, and because we feel the coarse metric weights to be somewhat arbitrary, we focus on these fine, feature-level metrics. We summarize Gartner’s descriptions; the full report is available directly from Gartner or indirectly via Teradata.
Access to Multiple Data Sources indicates the range of user queries with respect to multiple data types, multiple data sources, and external data located in secondary RDMBs or Hadoop clusters.
Administration and Management reflects overall easy of use including implementation, daily use, and upgrade phases.
Advanced Analytics meaures the availability and use-frequency of internal analytic features.
Data Ingest is the ability to access recently ingested data in near real time.
Managing Large Volumes of Data is a measure of the ability of the system to handle large, i.e., over 150TB, data sets.
Optimized Performance (Traditional) is how well the system optimizes routine, e.g. repeated or complex, queries.
Optimized Performance (Exploratory) is how well the system is designed to execute exploratory, e.g., ad-hoc or model-training, queries.
Flexible Scalability is how easily the system responds to changing resource demands, including scaling up, scaling out, and separation of compute and storage.
Variety of Data Types is a reflection of how well the system handles structured as well as semi-structured data, such as JSON, geospatial, temporal, etc.
Workload Management measures how well the system handles variability in the demand and size of user queries.
Use Support (Traditional) is a measure of how well user needs are met for nontechnical business and casual users, including OLAP, data cubes, portals, or other prebuilt interfaces not requiring any faculty with computer languages or data processing techniques.
Use Support (Exploratory) is a measure of how well user needs are met for data science users, including exploratory workloads such as model building, predictive analytics, and prescriptive analytics.
Your Data Warehouse
Your Data Warehouse
In order to start the data warehouse migration process, it’s reasonable to first assess your needs, and perhaps easiest to do so in the context of a well-researched comparative analysis such as the Gartner paper described above. There’s a certain comfort in outsourcing the enumeration of critical features to a reputable source; in doing so, there is far less risk of ending up with a deficient assessment of the space.
If you’re comfortable with the criteria above, the following web form could help you kick off your data warehouse RFP adventure. In the event that this still feels overwhelming, feel free to reach out directly. Or, take a look at the gentle introduction, Cloud Data Warehousing for Dummies freely available from Snowflake Computing.
Customized Results
Simple: pick the features you need.
Preferences
Results
Be aware
The pricing across these platforms varies dramatically, and a top ranked product satisfying your constraints may be cost-prohibitive.
Our evaluation methodology precludes reporting any product that doesn’t obtain a passing score in every category specified. Thus, a lower-ranked, reported product should still meet your needs and may be more cost-appropriate.
Your existing solution might be good enough, or at least cheaper to renovate, than a full retooling of your existing data solution.
Your existing solution may have tacit dependencies that are incompatible with certain products.
Finally, know that most datasets aren’t large enough to require cloud-based data warehouse solutions; and most insights are lower hanging fruits, readily discovered with simple methodologies. It’s worth asking again, “do you really need this technology?”
