Reproducing Results: ARM, Chapter 3
This notebook reproduces tables and figures in ARM, Chapter 3 [GH07]
Dustin Lennon
February 2021
https://dlennon.org/archive/20210217_armch03
ARM03: Linear regression, the basics
ARM03: Linear regression, the basics
This chapter introduces OLS by example using the child.iq dataset. The columns are:
- the child’s test score,
- a binary variable indicating if the mother finished high school,
- the mother’s IQ
- a categorical variable denoting the mother’s education level
- no hs education (1)
- high school graduate (2)
- some college (3)
- college graduate (4)
- the mother’s age
# Custom imports
import common
import datasets
import pydlennon.extensions.matplotlib
import arm
# Standard imports
import numpy as np
import pandas as pd
import statsmodels.api as sm
import patsy
import matplotlib.pyplot as plt
import scipy.stats
# Load the child.iq dataset
dsf = datasets.Factory()
dfa = dsf('armch03.childiq')
dfa.head()
| kid_score | mom_hs | mom_iq | mom_age | |
|---|---|---|---|---|
| 0 | 65 | 1 | 121.117529 | 27 |
| 1 | 98 | 1 | 89.361882 | 25 |
| 2 | 85 | 1 | 115.443165 | 27 |
| 3 | 83 | 1 | 99.449639 | 25 |
| 4 | 115 | 1 | 92.745710 | 27 |
Section 3.1: One Predictor
Section 3.1: One Predictor
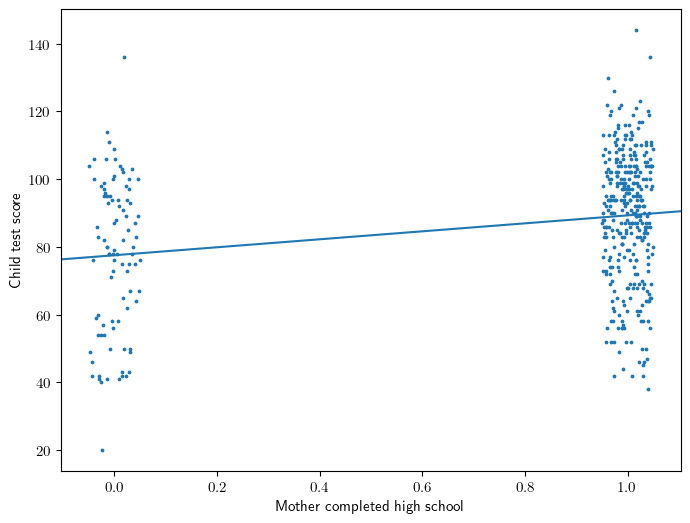
Equation 3.1: a binary predictor
\[ kid\_score = 78 + 12 \cdot mom\_hs + error \]
Interpretation
- 78 is the average score of the kids whose mothers did not complete high school.
- 90 = 78 + 12 is the average score of the kids whose mothers did complete high school.
y,X = patsy.dmatrices("kid_score ~ mom_hs", data=dfa, return_type='dataframe')
model = sm.OLS(y,X).fit()
model.summary().tables[1]
| coef | std err | t | P>|t| | [0.025 | 0.975] | |
|---|---|---|---|---|---|---|
| Intercept | 77.5484 | 2.059 | 37.670 | 0.000 | 73.502 | 81.595 |
| mom_hs[T.1] | 11.7713 | 2.322 | 5.069 | 0.000 | 7.207 | 16.336 |
Figure 3.1
x = X['mom_hs[T.1]']
jx = x + np.random.uniform(-0.05, 0.05, size=len(x))
intercept,slope = model.params

ax = plt.gca()
ax.scatter(jx, y, s=3)
ax.abline(intercept, slope)
ax.set_ylabel('Child test score')
ax.set_xlabel('Mother completed high school');
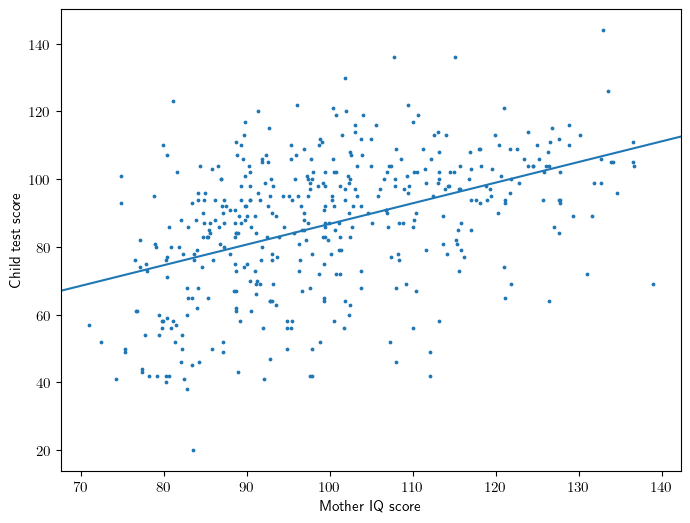
Equation 3.3: a continuous predictor
\[ kid\_score = 26 + 0.6 \cdot mom\_iq + error \]
Interpretation
- 26 is the average score of the kids whose mothers had a zero IQ (not meaningful!)
y,X = patsy.dmatrices("kid_score ~ mom_iq", data=dfa, return_type='dataframe')
model = sm.OLS(y,X).fit()
model.summary().tables[1]
| coef | std err | t | P>|t| | [0.025 | 0.975] | |
|---|---|---|---|---|---|---|
| Intercept | 25.7998 | 5.917 | 4.360 | 0.000 | 14.169 | 37.430 |
| mom_iq | 0.6100 | 0.059 | 10.423 | 0.000 | 0.495 | 0.725 |
Figure 3.2
x = X['mom_iq']
intercept,slope = model.params

ax = plt.gca()
ax.scatter(x,y,s=3)
ax.abline(intercept, slope)
ax.set_ylabel('Child test score')
ax.set_xlabel('Mother IQ score');
Section 3.2: Multiple Predictors
Section 3.2: Multiple Predictors
Equation 3.4
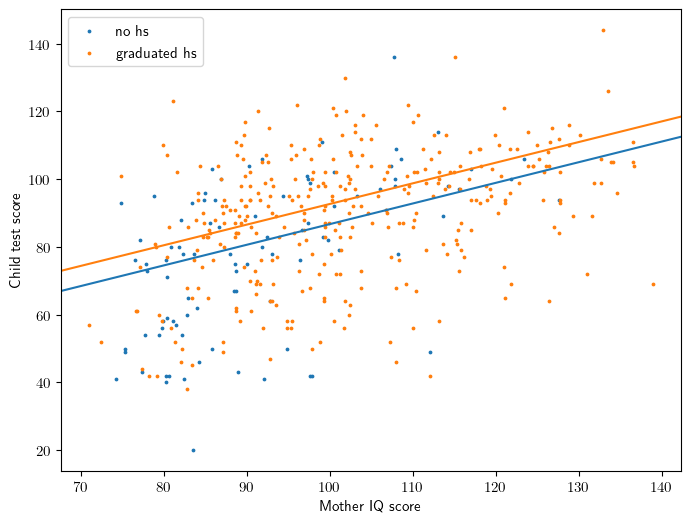
\[ kid\_score = 26 + 6 \cdot mom\_hs + 0.6 \cdot mom\_iq + error \]
Interpretation
- 26 is the average score of the kids whose mothers had a zero IQ (not meaningful!)
- For children whose mothers have the same IQ, the model predicts an increase of 6 points on a child’s test score when the mother has completed high school.
- For children whose mothers have the same educational attainment, the model predicts an increase of 0.6 points on a child’s test score when the mother has an increase of one IQ point.
y,X = patsy.dmatrices("kid_score ~ mom_hs + mom_iq", data=dfa, return_type='dataframe')
model = sm.OLS(y,X).fit()
model.summary().tables[1]
| coef | std err | t | P>|t| | [0.025 | 0.975] | |
|---|---|---|---|---|---|---|
| Intercept | 25.7315 | 5.875 | 4.380 | 0.000 | 14.184 | 37.279 |
| mom_hs[T.1] | 5.9501 | 2.212 | 2.690 | 0.007 | 1.603 | 10.297 |
| mom_iq | 0.5639 | 0.061 | 9.309 | 0.000 | 0.445 | 0.683 |
Figure 3.3
ax = plt.gca()
gb = X.groupby('mom_hs[T.1]')
for i,gname in enumerate(['no hs', 'graduated hs']):
    gval = [0.0,1.0][i]
    gidx = gb.groups[gval]

    xss = x.loc[gidx]
    yss = y.loc[gidx]
    ax.scatter(xss,yss,color=common.colors[i], label=gname, s=3)

    iss = model.params['Intercept'] + model.params['mom_hs[T.1]']*gval
    ax.abline(iss, slope, color=common.colors[i])

ax.set_ylabel('Child test score')
ax.set_xlabel('Mother IQ score');

ax.legend();
3.3 Interactions
3.3 Interactions
Equation
\[ kid\_score = \ -11 \ + 51 \cdot mom\_hs \ + 1.0 \cdot mom\_iq \ - 0.5 \cdot mom\_hs \cdot mom\_iq \ + error \]
Interpretation
- The interaction term is interpretable as a difference in slope for mom_iq.
y,X = patsy.dmatrices("kid_score ~ mom_hs + mom_iq + mom_hs:mom_iq", data=dfa, return_type='dataframe')
model = sm.OLS(y,X).fit()
model.summary().tables[1]
| coef | std err | t | P>|t| | [0.025 | 0.975] | |
|---|---|---|---|---|---|---|
| Intercept | -11.4820 | 13.758 | -0.835 | 0.404 | -38.523 | 15.559 |
| mom_hs[T.1] | 51.2682 | 15.338 | 3.343 | 0.001 | 21.122 | 81.414 |
| mom_iq | 0.9689 | 0.148 | 6.531 | 0.000 | 0.677 | 1.260 |
| mom_hs[T.1]:mom_iq | -0.4843 | 0.162 | -2.985 | 0.003 | -0.803 | -0.165 |
Figure 3.4
fig = plt.figure(figsize=(10,4))
ax1 = fig.add_subplot(1,2,1)
ax2 = fig.add_subplot(1,2,2)

gb = X.groupby('mom_hs[T.1]')
for i,gname in enumerate(['no hs', 'graduated hs']):
    gval = [0.0,1.0][i]
    gidx = gb.groups[gval]

    xss = x.loc[gidx]
    yss = y.loc[gidx]
    ax1.scatter(xss,yss,color=common.colors[i], label=gname, s=3)
    ax2.scatter(xss,yss,color=common.colors[i], label=gname, s=3)

    iss = model.params['Intercept'] + model.params['mom_hs[T.1]']*gval
    sss = model.params['mom_iq']    + model.params['mom_hs[T.1]:mom_iq']*gval
    ax1.abline(iss, sss, color=common.colors[i])
    ax2.abline(iss, sss, color=common.colors[i])

ax2.set_xlim([-2,142])
ax2.set_ylim([-20,150])

for ax in [ax1,ax2]:
    ax.legend()
    ax.set_ylabel('Child test score')
    ax.set_xlabel('Mother IQ score');
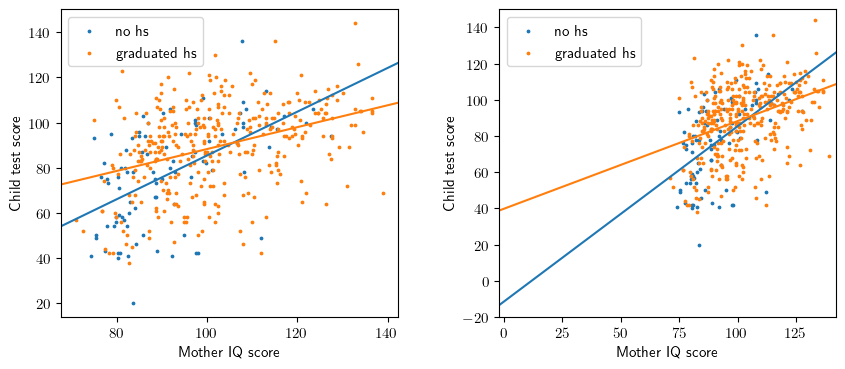
Figure 3.5
Omitted, unknown data source.
Figure 3.6
Omitted, expository.
Figure 3.7
Omitted, expository.
3.4 Statistical Inference
3.4 Statistical Inference
Figure 3.8
dfb = dsf('armch03.vitals')
dfb.head()
| height | weight | |
|---|---|---|
| 0 | 66.0 | 140.0 |
| 1 | 64.0 | 150.0 |
| 2 | 74.0 | 210.0 |
| 3 | 66.0 | 125.0 |
| 4 | 64.0 | 126.0 |
# Fit the data
y1,X = patsy.dmatrices("np.log(weight) ~ height", data=dfb, return_type='dataframe')
m1 = sm.OLS(y1,X).fit()

# Fit the perturbed data
dfc = dfb.copy()
dfc['log_weight'] = m1.predict() + np.random.normal(scale=0.32, size=len(y1))
y2,_ = patsy.dmatrices("log_weight ~ height", data=dfc, return_type='dataframe')
m2 = sm.OLS(y2,X).fit()
fig = plt.figure(figsize=(10,4))
ax1 = fig.add_subplot(1,2,1)
ax2 = fig.add_subplot(1,2,2)

template = r'$\widehat{{\sigma}} = {0:.2f}$'

x = X.height
jx = x + np.random.uniform(-0.25,0.25, size=len(x))

ax1.scatter(jx, y1, s=3)
ax1.abline(m1.params['Intercept'], m1.params['height'])
ax1.text(0.75, 0.1, template.format(np.sqrt(m1.scale)), transform=ax1.transAxes);

ax2.scatter(jx, y2, s=3)
ax2.abline(m2.params['Intercept'], m2.params['height'])
ax2.text(0.75, 0.1, template.format(np.sqrt(m2.scale)), transform=ax2.transAxes);

for ax in [ax1,ax2]:
    ax.set_ylim(3.75, 6.5)
    ax.set_xlabel('height')
    ax.set_ylabel('log(weight)')
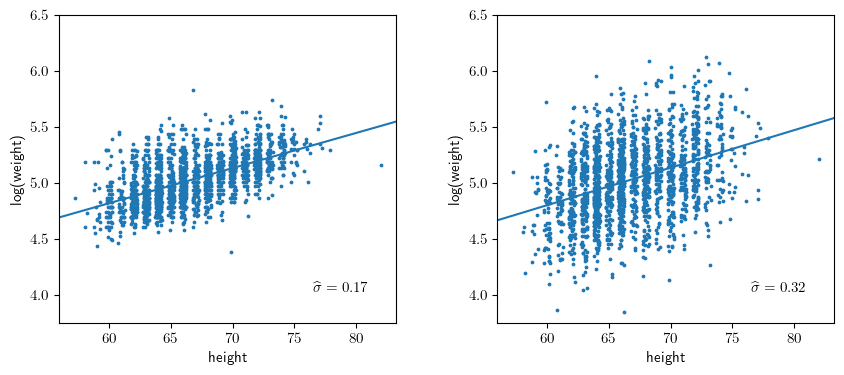
Figure 3.9
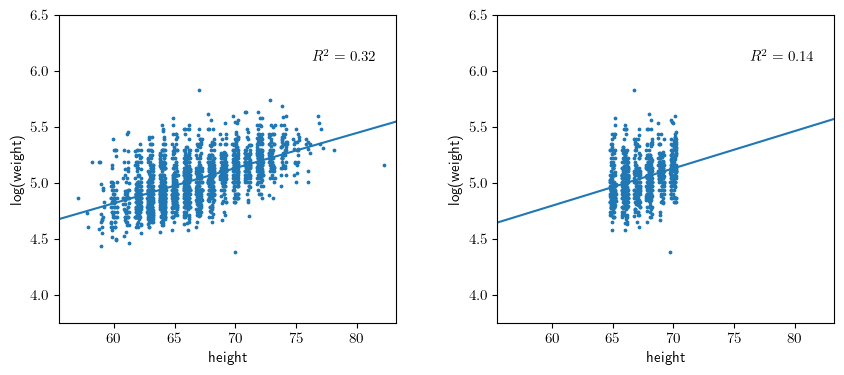
hidx = (65 <= dfb.height ) & ( dfb.height <= 70 )
dfd = dfb.loc[hidx].copy()

y3,X3 = patsy.dmatrices("np.log(weight) ~ height", data=dfd, return_type='dataframe')
m3 = sm.OLS(y3,X3).fit()
fig = plt.figure(figsize=(10,4))
ax1 = fig.add_subplot(1,2,1)
ax2 = fig.add_subplot(1,2,2)

template = r'$R^2 = {0:.2f}$'

x = X.height
jx = x + np.random.uniform(-0.25,0.25, size=len(x))

x3 = X3.height
jx3 = x3 + np.random.uniform(-0.25,0.25, size=len(x3))

ax1.scatter(jx, y1, s=3)
ax1.abline(m1.params['Intercept'], m1.params['height'])
ax1.text(0.75, 0.85, template.format(m1.rsquared), transform=ax1.transAxes);

ax2.scatter(jx3, y3, s=3)
ax2.abline(m3.params['Intercept'], m3.params['height'])
ax2.text(0.75, 0.85, template.format(m2.rsquared), transform=ax2.transAxes);

for ax in [ax1,ax2]:
    ax.set_xlim(55.5, 83.25)
    ax.set_ylim(3.75, 6.5)
    ax.set_xlabel('height')
    ax.set_ylabel('log(weight)')
Section 3.5: Graphical displays of data and fitted model
Section 3.5: Graphical displays of data and fitted model
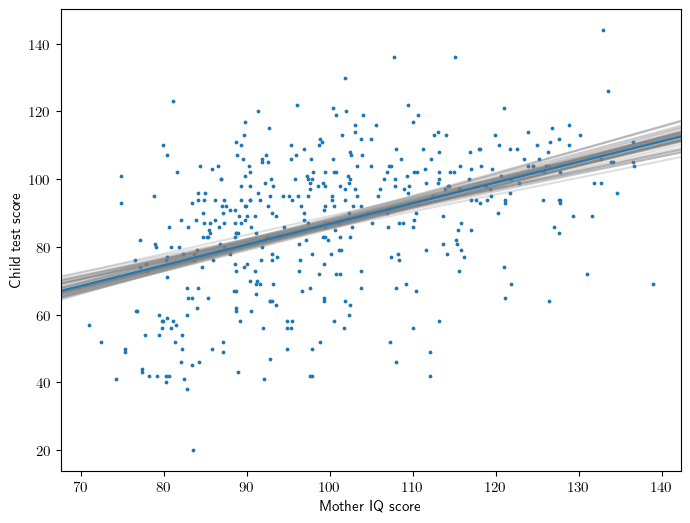
Figure 3.10
# Fit model
y,X = patsy.dmatrices("kid_score ~ mom_iq", data=dfa, return_type='dataframe')
model = sm.OLS(y,X).fit()

# Simulate: parametric bootstrap
beta_sim = arm.sim(model, 50)

# Figure 3.10
ax = plt.gca()

x = X['mom_iq']
intercept,slope = model.params

ax = plt.gca()
ax.scatter(x,y,s=3)
ax.abline(model.params['Intercept'], model.params['mom_iq'])
ax.set_ylabel('Child test score')
ax.set_xlabel('Mother IQ score');

for beta in beta_sim:
    intercept,slope = beta
    ax.abline(intercept, slope, color='gray', alpha=0.25, zorder=1)
# Fit model
y,X = patsy.dmatrices("kid_score ~ mom_hs + mom_iq", data=dfa, return_type='dataframe')
model = sm.OLS(y,X).fit()

xhs = X['mom_hs[T.1]']
jxhs = xhs + np.random.uniform(-0.05, 0.05, size=len(xhs))

xiq = X['mom_iq']

beta_hat = model.params.to_numpy()
beta_sim = arm.sim(model, 50)

# Set up figure, axes
fig = plt.figure(figsize=(10,4))
ax1 = fig.add_subplot(1,2,1)
ax2 = fig.add_subplot(1,2,2)

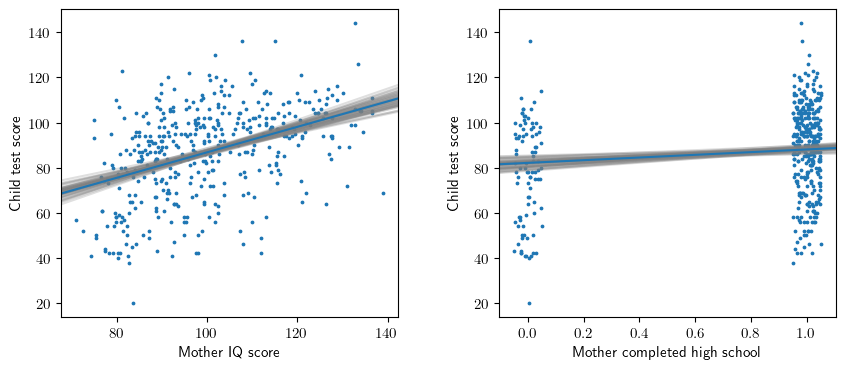
# Figure 3.11
ax1.scatter(xiq,y,s=3)
ax1.set_ylabel('Child test score')
ax1.set_xlabel('Mother IQ score');

ax2.scatter(jxhs,y,s=3)
ax2.set_ylabel('Child test score')
ax2.set_xlabel('Mother completed high school');

# Plot the regression lines
intercept,slope_hs,slope_iq = beta_hat
b1 = intercept + slope_hs * xhs.mean()
ax1.abline(b1, slope_iq, color=common.colors[0])

b2 = intercept + slope_iq * xiq.mean()
ax2.abline(b2, slope_hs, color=common.colors[0])

# Add parametric bootstrap
for beta in beta_sim:
    intercept,slope_hs,slope_iq = beta
    b1 = intercept + slope_hs * xhs.mean()
    ax1.abline(b1, slope_iq, color='gray', alpha=0.25, zorder=1)

    b2 = intercept + slope_iq * xiq.mean()
    ax2.abline(b2, slope_hs, color='gray', alpha=0.25, zorder=1)
Section 3.6: Assumption and diagnostics
Section 3.6: Assumption and diagnostics
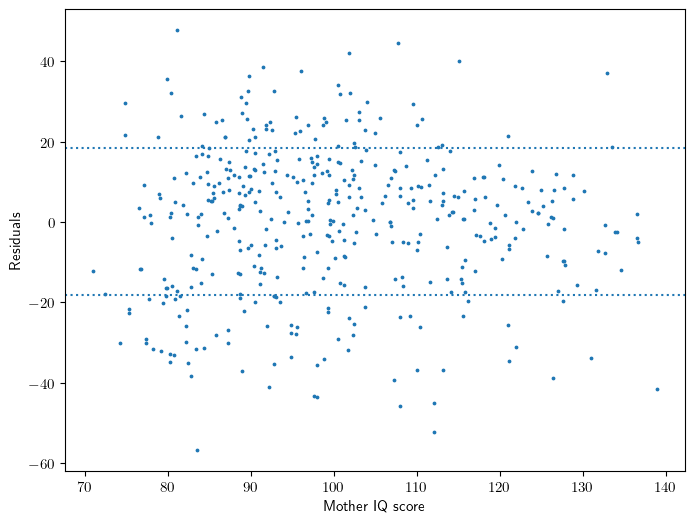
Figure 3.12
# Fit model
y,X = patsy.dmatrices("kid_score ~ mom_iq", data=dfa, return_type='dataframe')
model = sm.OLS(y,X).fit()

sigma = np.sqrt(model.scale)

# Set up figure
ax = plt.gca()

# Figure 3.12
ax.scatter(X['mom_iq'], model.resid, s=3)
ax.axhline(-sigma, ls=':')
ax.axhline(sigma, ls=':')
ax.set_xlabel('Mother IQ score')
ax.set_ylabel('Residuals');
Section 3.7: Prediction and validation
Section 3.7: Prediction and validation
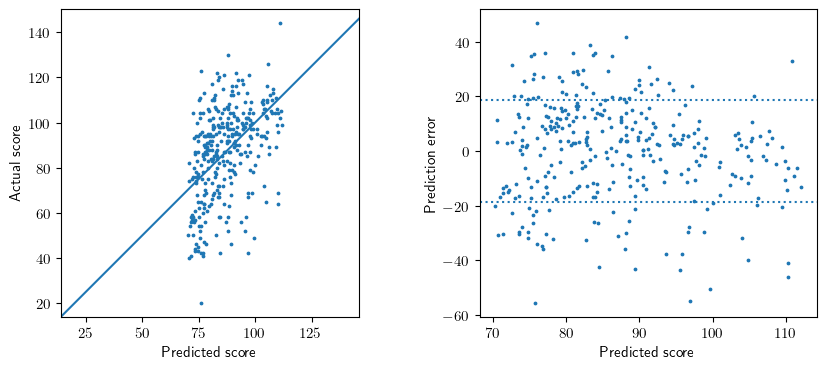
Figure 3.13
Comparable, unknown data source.
# Create training/test sets
rng = np.random.default_rng(seed=442)
ids = dfa.index.to_list()
train_ids = rng.choice(ids, size=100, replace=False)
test_ids = set(ids).difference(train_ids)

# Fit the model
y,X = patsy.dmatrices("kid_score ~ mom_iq + mom_age", data=dfa, return_type='dataframe')
y_train,X_train = (y.loc[train_ids], X.loc[train_ids])
y_test,X_test = (y.loc[test_ids], X.loc[test_ids])
model = sm.OLS(y_train,X_train).fit()
Statsmodels: prediction intervals
The statsmodels package produces the following output from its get_prediction method:
# Prediction intervals; mean and observation
pred = model.get_prediction(X_test)
alpha = 0.05
record_id = 0
display(pred.summary_frame(alpha=alpha).iloc[[record_id]])
| mean | mean_se | mean_ci_lower | mean_ci_upper | obs_ci_lower | obs_ci_upper | |
|---|---|---|---|---|---|---|
| 0 | 104.847102 | 4.363815 | 96.186137 | 113.508067 | 67.220573 | 142.47363 |
We can reproduce these results manually. Recall that our model, using vector notation, is specified by:
\[ \begin{gather*} y = X \beta + \epsilon \\ \varepsilon \sim N(0, I_n) \end{gather*} \]
We obtain the MLE:
\[ \hat{\beta} = (X^{\top} X)^{-1} X^{\top} y \]
It follows that the variance of the MLE is:
\[ \Varp{\hat{\beta}} = \sigma^2 \left( \matr{X}\tran \matr{X} \right)^{-1} \]
For a new observation, our estimator is:
\[ \tilde{y}_0 = x_0\tran \hat{\beta} + \epsilon_0 \]
and the variance of this estimator,
\[ \Varp{\tilde{y}} = \sigma^2 \left[ 1 + x_0\tran \left( \matr{X}\tran \matr{X} \right)^{-1} x_0 \right] \]
where we see contributions from both \(\epsilon_0\) and \(\beta\). Both of these contribute to the variance of the observation. However, if the interest is on the mean of the prediction–say in a group context–then one needs only consider the contribution from \(\beta\). This leads to the observation and mean confidence intervals respectively.
# Manual calculation
beta = model.params.values
x0 = X_test.iloc[record_id].values
mean = x0 @ beta

XtX_inv = model.normalized_cov_params
mean_se = np.sqrt(model.scale) * np.sqrt(x0 @ XtX_inv @ x0)
obs_se = np.sqrt(model.scale) * np.sqrt(1 + x0 @ XtX_inv @ x0)

tscore = scipy.stats.t.ppf(1 - alpha/2, df=model.df_resid)
d = {
    'mean' : mean,
    'mean_se' : mean_se,
    'mean_ci_lower' : mean - tscore*mean_se,
    'mean_ci_upper' : mean + tscore*mean_se,
    'obs_ci_lower' : mean - tscore*obs_se,
    'obs_ci_upper' : mean + tscore*obs_se
}
pd.DataFrame([d])
| mean | mean_se | mean_ci_lower | mean_ci_upper | obs_ci_lower | obs_ci_upper | |
|---|---|---|---|---|---|---|
| 0 | 104.847102 | 4.363815 | 96.186137 | 113.508067 | 67.220573 | 142.47363 |
# Figure 3.13

# Set up figure, axes
fig = plt.figure(figsize=(10,4))
ax1 = fig.add_subplot(1,2,1)
ax2 = fig.add_subplot(1,2,2)

# Figure 3.13a
x = pred.predicted_mean
y = y_test['kid_score'].values
ax1.scatter(x, y, s=3)
ax1.axline((20,20),(140,140))
ax1.set_aspect(1.0)
ax1.set_xlabel('Predicted score')
ax1.set_ylabel('Actual score');

# NB - the prediction confidence interval adds about 3%, on average, to the observation variance
m = (X_test.values * (X_test.values @  XtX_inv)).sum(axis=1).mean()
sigma = np.sqrt( model.scale * (1 + m) )

# Figure 3.13b
ax2.scatter(x, y - x, s=3)
ax2.axhline(-sigma, ls=':')
ax2.axhline(sigma, ls=':')
ax2.set_xlabel('Predicted score')
ax2.set_ylabel('Prediction error');
Bibliography
Bibliography
[GH07] Gelman, A., and Hill, J. (2007). Data Analysis Using Regression and Multilevel/Hierarchical Models. Chapter 3.
